Executive Summary: Separating a Bullseye on VC Token Circularity from a Macroeconomic Accounting Illusion
On October 24, 2026, Dr. Torsten Sløk, Chief Economist at Apollo Global Management, published a concise, five-chart note in The Daily Spark titled “No Signs of AI Payoff Outside the Tech Sector”. Within hours, the note became the defining macroeconomic bear thesis on enterprise artificial intelligence:
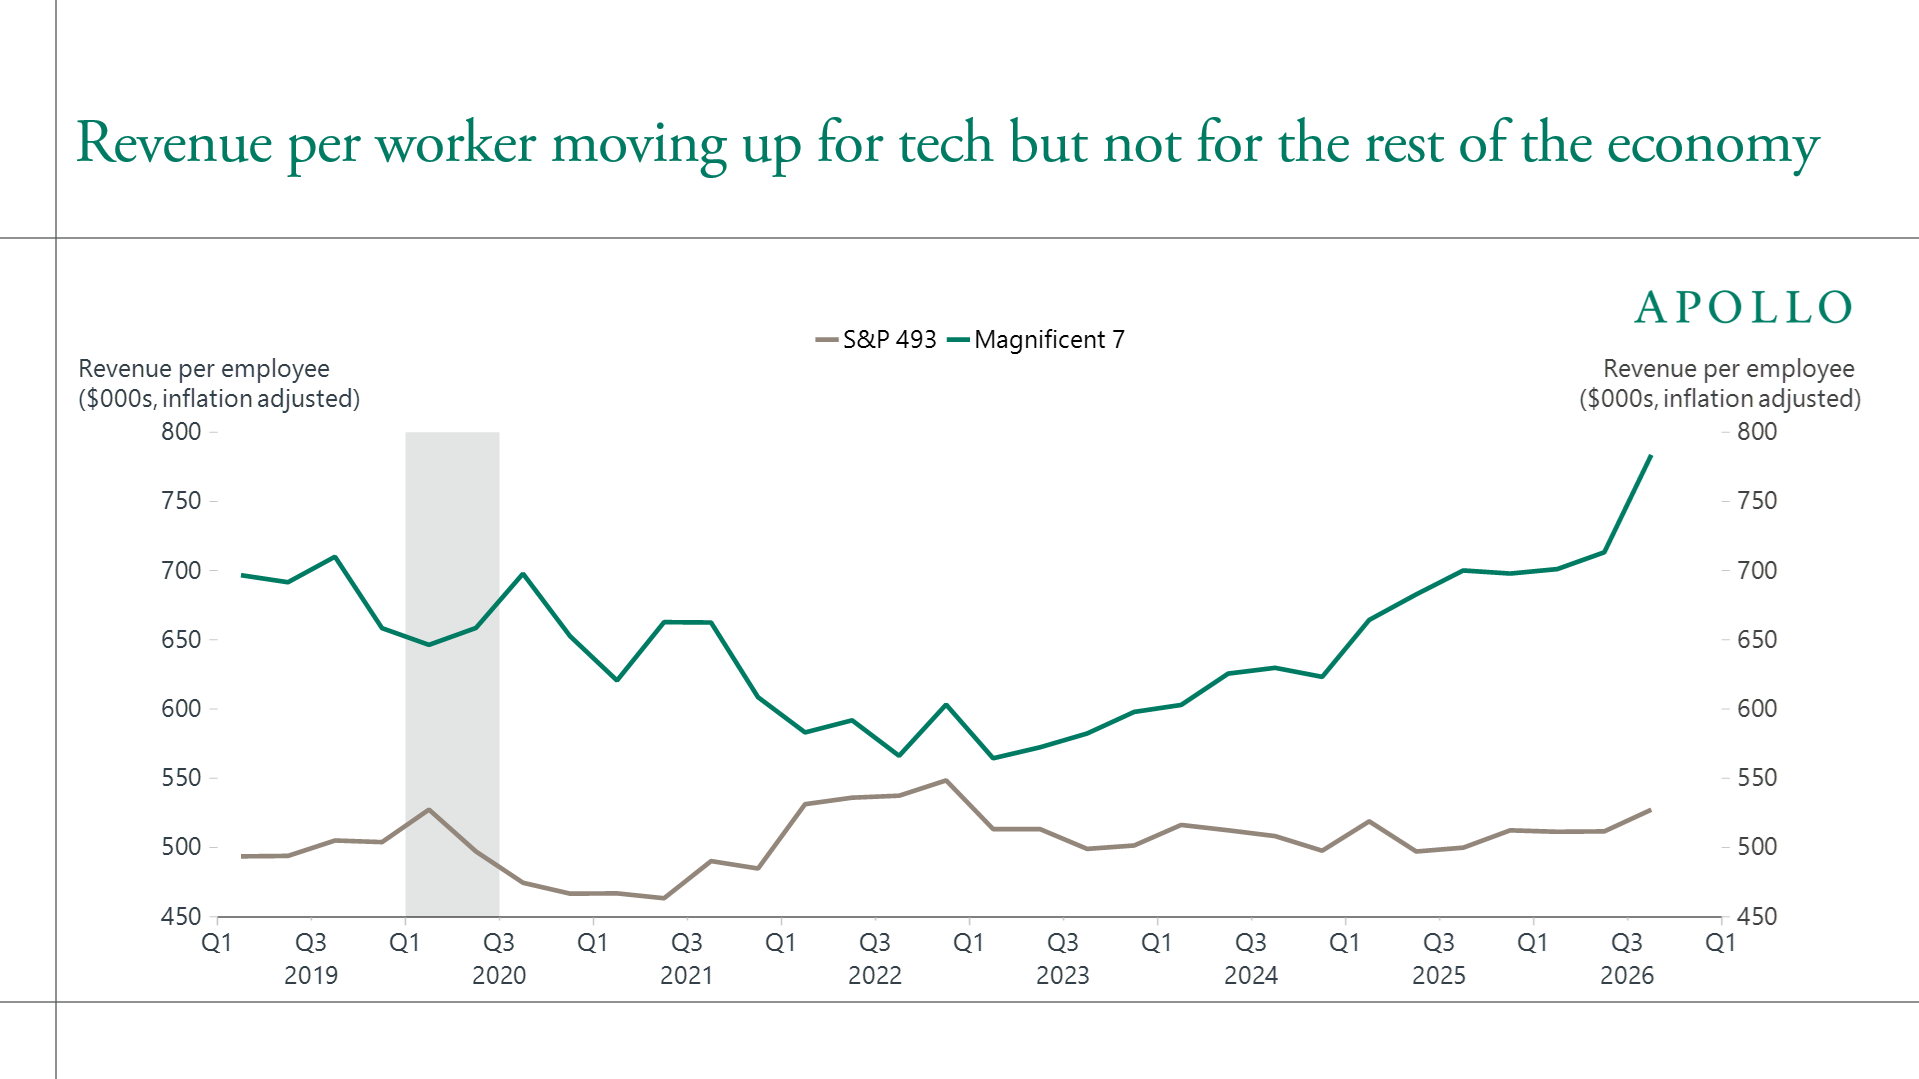
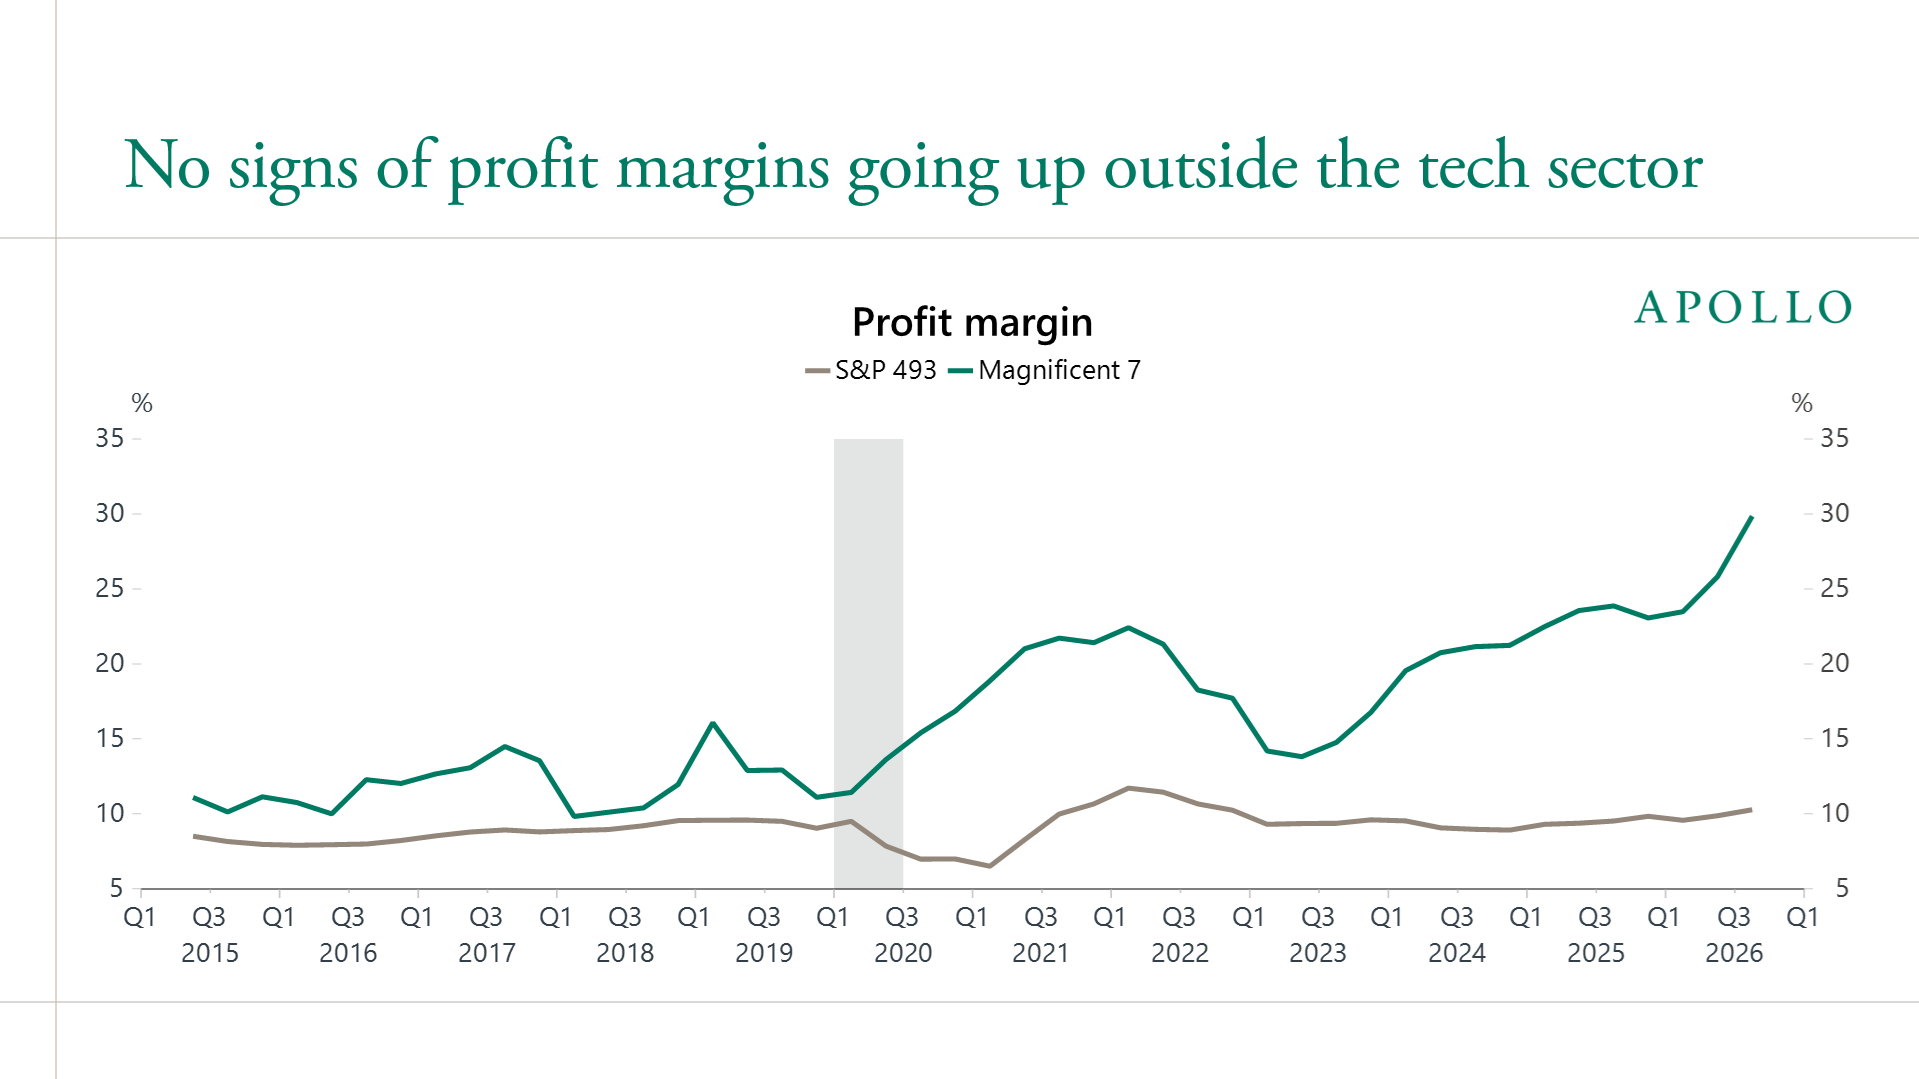
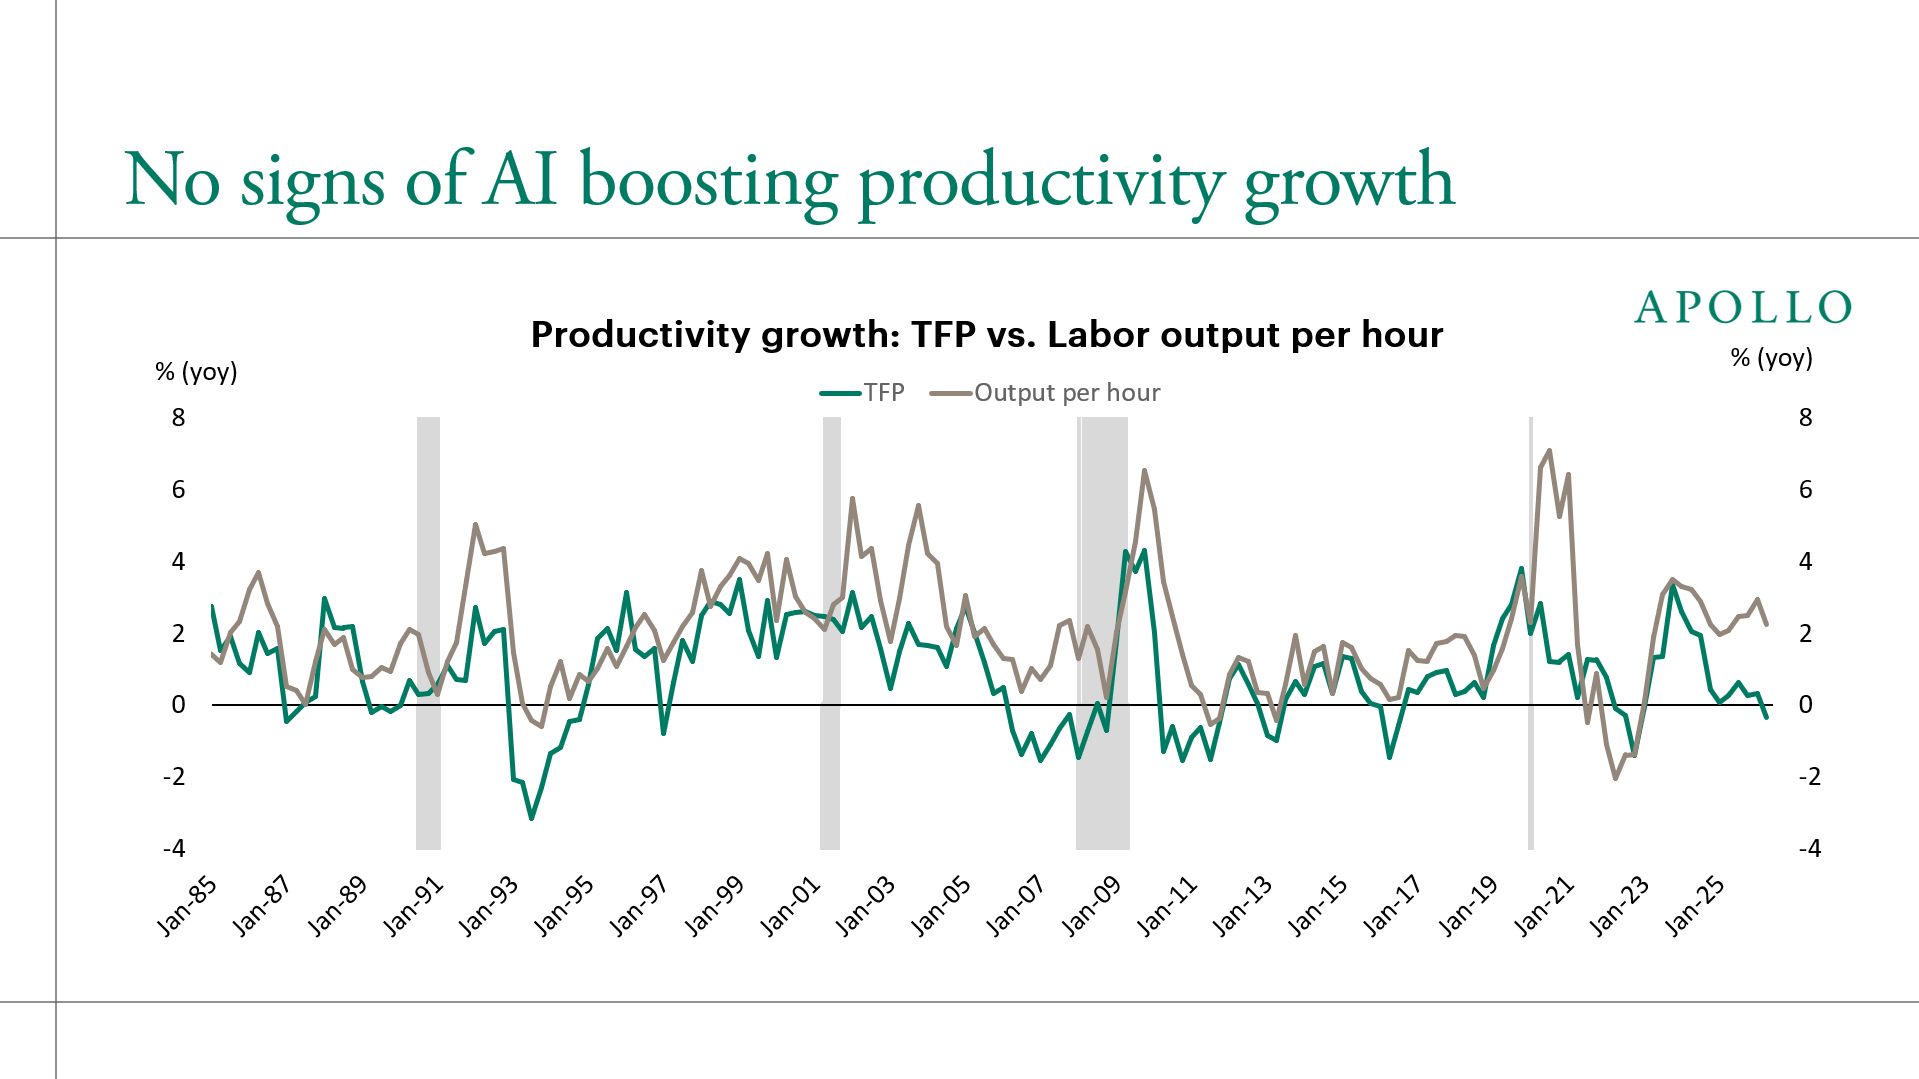
“Despite massive investments and widespread hype around artificial intelligence, the technology has delivered zero financial payoff to corporate America outside of tech. Revenue per worker is rising for the Mag 7 but is flat for the S&P 493, see the first chart below. Profit margins are rising for the Mag 7 but are flat for the S&P 493, see the second chart below. And there are still no signs of AI boosting productivity growth, see the third chart below. With no impact on the bottom line, mainstream corporate America is pulling back and starting to view token spending not as a source of growth but as a cost center that weighs on margins.
VC-backed companies are spending more and more on tokens, but mainstream corporate America does not need the latest model and is unwilling to pay for it. As long as agentic AI and token spending are confined to a small part of the economy, the macroeconomic effects of AI will be very limited, see the fourth and fifth charts below.
The question looking ahead is whether, even as models become commoditized, mainstream corporate America can turn increasingly cheap intelligence into higher revenue growth and higher profit margins. That may be harder than it sounds. AI may be a great calculator, but in business, intelligence is mostly judgment. Judgment depends on context, and the answer varies with which human or which model you ask. Perhaps most importantly, AI does not understand accountability, trust, culture, unwritten rules, ethical trade-offs or fairness, all of which shape reputational risk and ultimately drive revenue growth and profit margins.
The bottom line is that the AI story will be decided in the S&P 493, not the Mag 7, and so far, there is no evidence that revenue growth or margins are improving outside the tech sector.” — Dr. Torsten Sløk, Chief Economist, Apollo Global Management (The Daily Spark, October 24, 2026)
Is Sløk right that AI has delivered zero financial payoff outside the tech sector? Applying Browne and Keeley’s “Panning for Gold” critical thinking framework across all five of Apollo’s primary charts (Chart 1, Chart 2, Chart 3, Chart 4, Chart 5), the San Francisco Fed Total Factor Productivity (TFP) dataset, BLS Nonfarm Labor Productivity (OPHNFB), and foundational NBER research (Brynjolfsson, Rock & Syverson 2021; Acemoglu 2024; Agrawal, Gans & Goldfarb 2018), we find a sharp split: Sløk hits a forensic bullseye on VC token circularity, near-term SaaS cost bloat, and the liability limits of AI judgment, but commits three classic statistical and macroeconomic fallacies in his reading of S&P 493 revenue per worker, TFP growth accounting, and firm-size spend concentration.
| Apollo Daily Spark Claim & Primary Chart | Forensic Verdict | Epistemic Validity | Core Empirical & Statistical Audit |
|---|---|---|---|
1. Chart 1: Inflation-adjusted revenue per worker is surging for the Mag 7 (~USD 782k) but flat for the S&P 493 (~USD 527k) |
TRUE DATA, FLAWED INFERENCE | ~45% Valid (Macro Accounting Fallacy) | Mag 7 revenue/worker surged +38.4% (2023 Q1–2026 Q3) because they are the monopoly infrastructure sellers (Nvidia, MSFT, GOOGL, AMZN) who froze headcount after 2022. In competitive S&P 493 industries, process efficiency lowers relative prices (consumer surplus) or restrains hiring rather than expanding aggregate real top-line sales beyond real GDP growth. |
2. Chart 2: Net profit margins are surging for the Mag 7 (~29.8%) but flat for the S&P 493 (~10.2%) — tokens act as a cost center |
STRONGLY AGREE | ~80% Valid | Through Q3 2026, blanket enterprise seat licenses (USD 30/user/mo) and un-targeted token spend have inflated S&P 493 IT budgets without net headcount reductions, transferring margin from S&P 493 buyers to Mag 7 sellers—though S&P 493 margins (10.2%) also absorbed post-ZIRP debt refinancing headwinds (+300 bps). |
3. Chart 3: SF Fed Utilization-Adjusted TFP is near 0.0% to -0.3% YoY, proving AI is not boosting macro productivity |
PARTIALLY AGREE | ~55% Valid (Ignores J-Curve & OPHNFB) |
On Chart 3 itself, BLS Labor Output per Hour (grey line) is running at a healthy ~2.3%–2.9% YoY in 2024–2026. Why is TFP (green line) at 0%? Because in Solow growth accounting, deploying USD 300B+/yr in AI data center CapEx (ΔK) before S&P 493 workflows are re-engineered mechanically depresses TFP—the exact Productivity J-Curve seen in 1991–1995 before the 1996–2004 internet boom. |
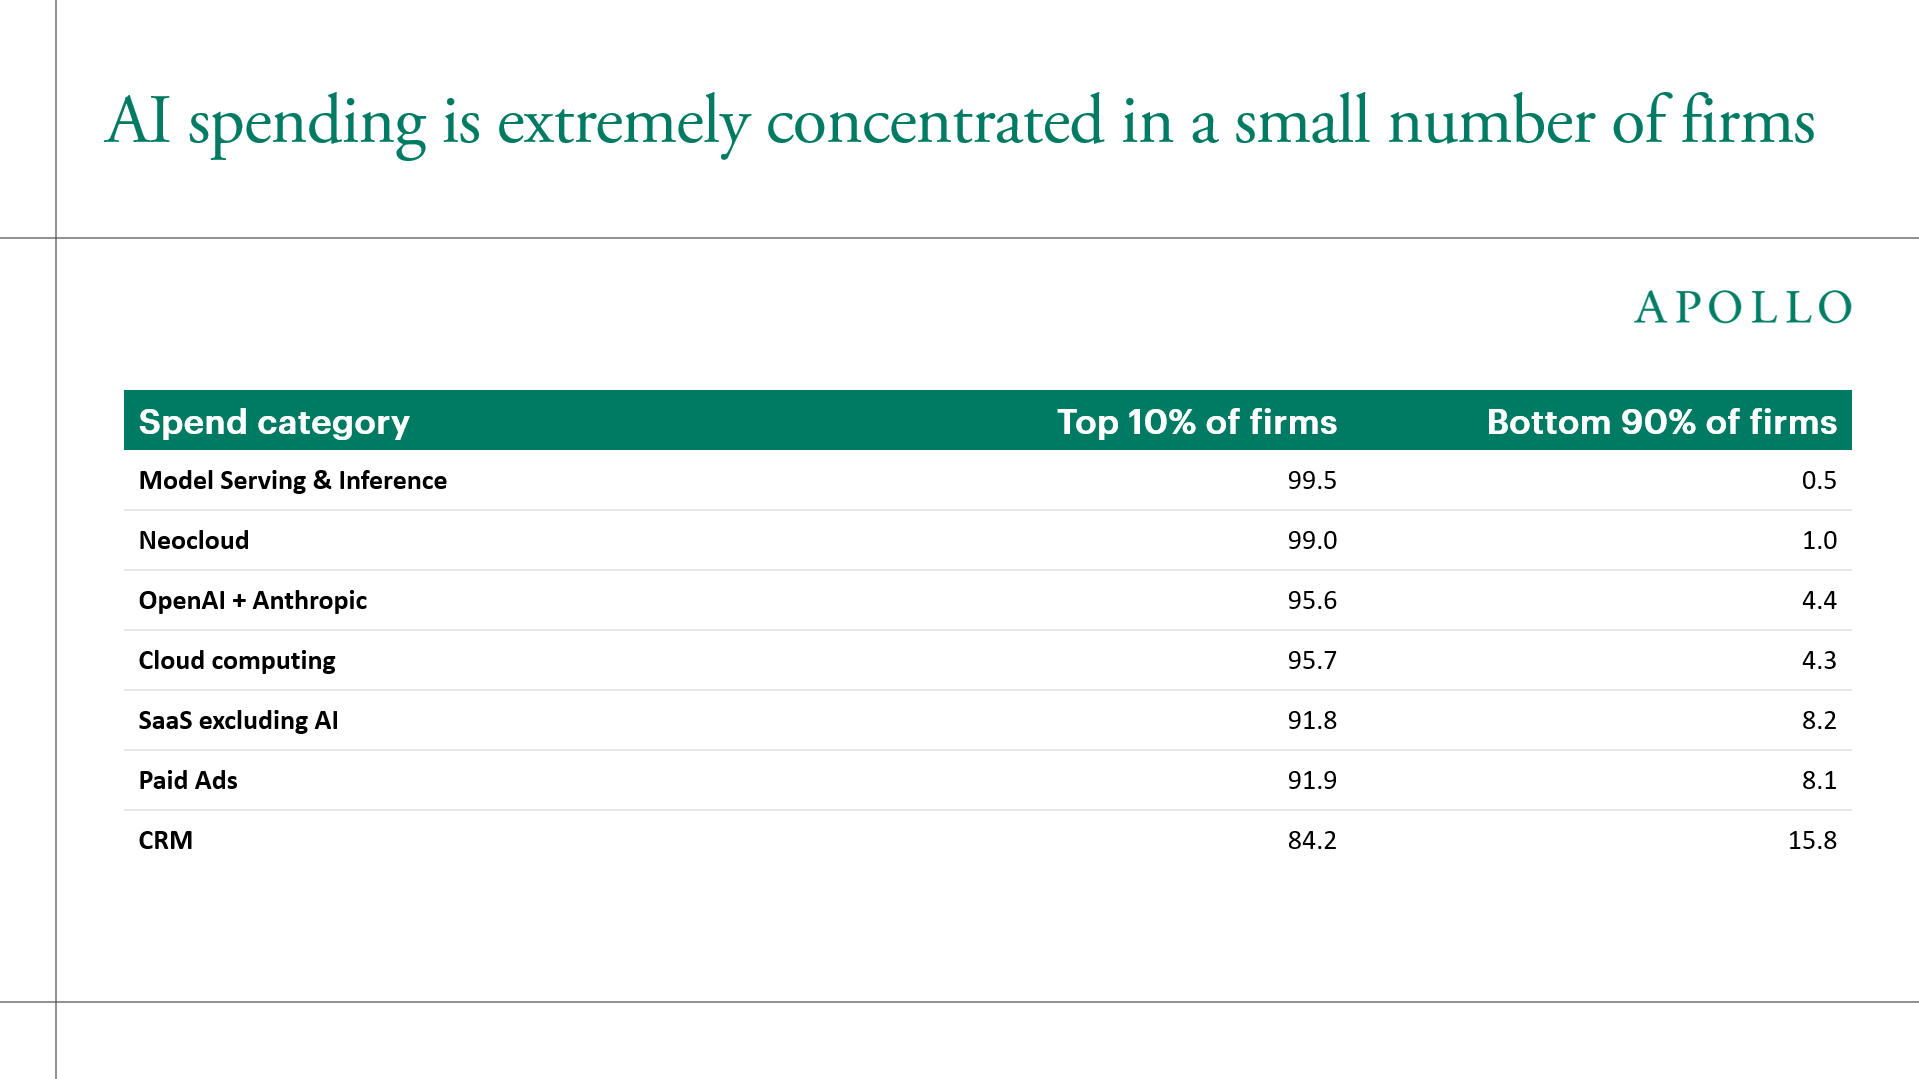
4. Chart 4: Top 10% of firms account for 95.6% of OpenAI + Anthropic spend and 99.5% of Model Serving (Ramp AI Index) |
DISAGREE | ~20% Valid (Fails Chapter 10 Blinding Test) | Look at the non-AI baseline rows inside Sløk’s own Chart 4: the Top 10% of firms account for 95.7% of Traditional Cloud Computing (0.1% more concentrated than OpenAI + Anthropic at 95.6%!), 91.8% of SaaS ex-AI, and 91.9% of Paid Ads. Because US firm size follows a Zipf/Pareto distribution (ζ ≈ 1.05), the Top 10% of firms always represent 90%–96% of B2B spend. |
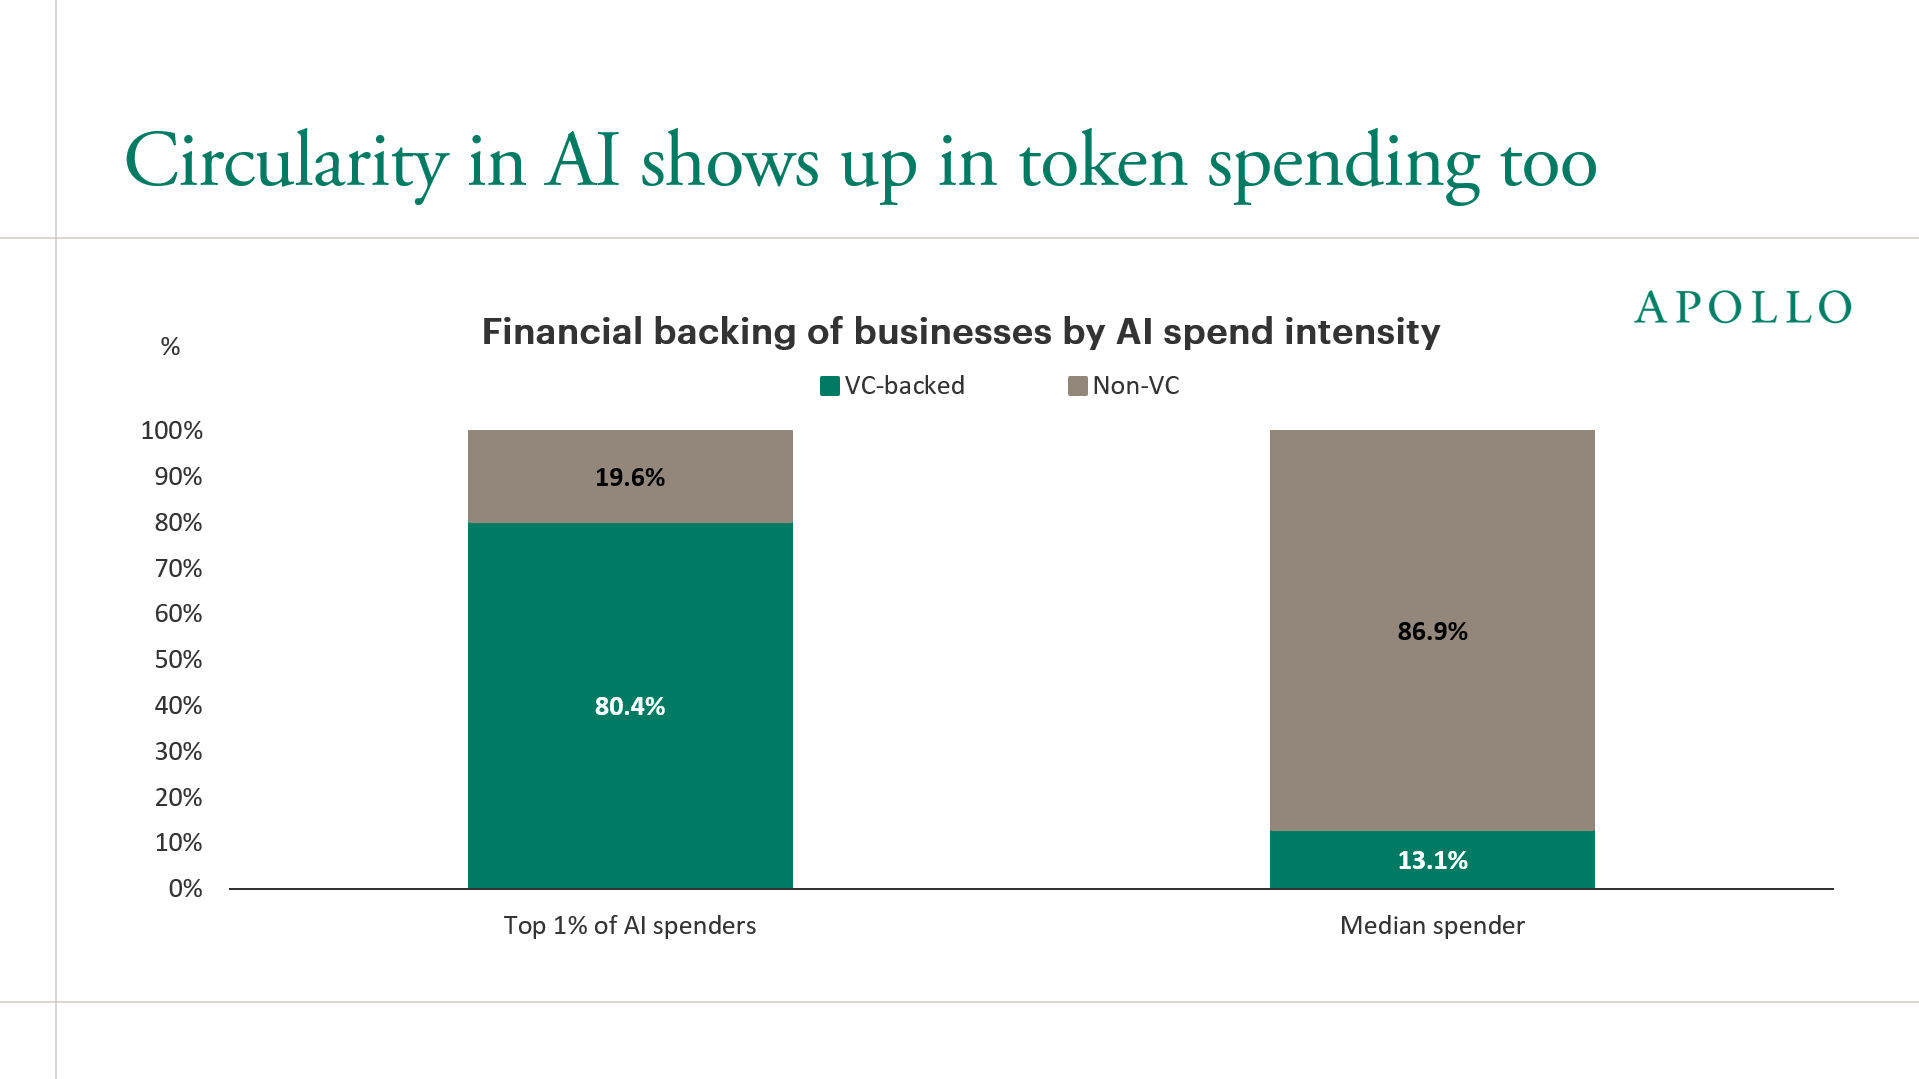
5. Chart 5: 80.4% of the Top 1% of AI spenders are VC-backed vs. 13.1% of median spenders (“Circularity in token spending”) |
STRONGLY AGREE | ~90% Valid (Bullseye) | Chart 5 exposes the VC-to-Hyperscaler Token Ouroboros: 80.4% of hyper-intensive token buyers on Ramp are VC-funded startups recycling venture capital back into OpenAI, Anthropic, and cloud providers, whereas 86.9% of median spenders are non-VC firms spending cautiously. |
| 6. Qualitative Thesis: “AI is a great calculator, but business intelligence is judgment, accountability, trust, and ethics” | STRONGLY AGREE | ~85% Valid | Corroborated by Agrawal, Gans & Goldfarb (NBER w24235) and Acemoglu (2024, NBER w32487): LLMs slash the cost of statistical prediction, but high-stakes S&P 493 decisions are bottlenecked by fiduciary liability, legal accountability, and non-stationary institutional context. |
Phase 1 & 2: Issue Framing, Primary Source Excavation, and Institutional Vantage Point
1.1 Classifying the Core Questions
To audit Apollo’s thesis rigorously, we decompose it into three testable questions:
- Descriptive Question 1 (Macro & Corporate Accounting): Do flat inflation-adjusted revenue per employee (
~USD 527k), flat net profit margins (~10.2%) in the S&P 493, and near-zero utilization-adjusted Total Factor Productivity (TFP) growth in 2025–2026 prove that AI is generating zero economic value outside the tech sector? - Descriptive Question 2 (Microeconomic Distribution & Circularity): Does the Ramp corporate-spend dataset (
Chart 4andChart 5) prove that AI adoption is uniquely confined to a closed loop of VC-backed tech companies? - Descriptive/Prescriptive Question 3 (Cognitive & Organizational Economics): Why does cheap statistical calculation fail to automatically translate into higher enterprise revenue and profit margins across the S&P 493?
1.2 Primary Artifact Excavation: Inside Apollo’s 5 Charts
Rather than relying on secondary news summaries, we extracted the exact numerical series from all five primary charts published in Apollo’s October 24, 2026 Daily Spark:
| Apollo Primary Artifact | Metric & Time Horizon | Key Quantitative Readings Extracted from Primary Chart | Primary Data Sources Cited by Apollo |
|---|---|---|---|
Chart 1 (Oct24_Chart1.png) |
Revenue per employee (USD 000s, inflation-adjusted to 2019 Q4), 2019 Q1 – 2026 Q3 |
Mag 7: ~USD 698k (2019 Q1) → dipped to ~USD 565k (2023 Q1 post-COVID hiring) → surged to ~USD 782k (2026 Q3) (+38.4% from trough).S&P 493: ~USD 495k (2019 Q1) → peaked at ~USD 548k (2022 Q4) → flat at ~USD 500k–527k across 2023 Q1 – 2026 Q3. |
Bloomberg, Macrobond, Apollo Chief Economist |
Chart 2 (Oct24_Chart2.png) |
Net Profit Margin (%), 2015 Q1 – 2026 Q3 |
Mag 7: ~11.0% (2015 Q1) → ~14.0% (2022 Q4) → soared to ~29.8% (2026 Q3).S&P 493: ~8.5% (2015 Q1) → ~11.8% (2021 Q4 stimulus peak) → flat between ~9.0% and 10.2% across 2023 Q1 – 2026 Q3. |
Bloomberg, Macrobond, Apollo Chief Economist |
Chart 3 (Oct24_Chart3.png) |
Productivity Growth: Utilization-Adjusted TFP vs. Labor Output per Hour (% YoY), 1985 – 2026 |
Labor Output per Hour (grey): Running at +2.2% to +2.9% YoY in 2024–2026.Utilization-Adjusted TFP (green): Peaked near +3.3% YoY in late 2023, then fell to ~0.0% to -0.3% YoY in 2025–2026. |
FRBSF (Fernald 2014), BLS, Apollo Chief Economist |
Chart 4 (Oct24_Chart4.png) |
Share of Spend by Top 10% vs. Bottom 90% of Firms (%) across 7 categories |
Top 10% Firm Share: Model Serving & Inference (99.5%), Neocloud (99.0%), Cloud computing (95.7%), OpenAI + Anthropic (95.6%), Paid Ads (91.9%), SaaS excluding AI (91.8%), CRM (84.2%). |
Ara Kharazian (Chief Economist, Ramp), Apollo Chief Economist |
Chart 5 (Oct24_Chart5.png) |
Financial Backing of Businesses by AI Spend Intensity (% VC-Backed vs. Non-VC) |
Top 1% of AI Spenders: 80.4% VC-backed | 19.6% Non-VC.Median Spender: 13.1% VC-backed | 86.9% Non-VC. |
Ramp AI Index, Apollo Chief Economist |
1.3 Institutional Vantage Point Audit (Why Apollo Is Asking This Question)
In Phase 2 (Chapter 8 of Browne & Keeley), we examine the institutional lens of the author. Apollo Global Management (NYSE: APO) manages over USD 700 billion in assets, anchored by Private Credit, Retirement Services (Athene), and Value-Oriented Old-Economy Private Equity (manufacturing, chemicals, industrial services, healthcare, and hospitality—the exact DNA of the S&P 493). Simultaneously, Apollo is a major debt financier of physical digital infrastructure (such as its USD 11B Intel Fab 34 Ireland joint venture and multi-billion-dollar data center credit facilities).
For a private credit and buyout titan like Apollo, the critical underwriting question of 2026–2030 is not whether Nvidia can sell GPUs today, but whether the non-tech industrial economy (the S&P 493 and mid-market buyout portfolio companies) will generate enough incremental cash flow from AI to justify the USD 300B+/year capital expenditure being financed by private credit.
Phase 3: Semantic Precision & The Substitution Test
Sløk’s note relies on two terms whose meanings shift between microeconomic operations and macroeconomic national income accounting: “AI Payoff” and “Intelligence vs. Judgment”.
3.1 Substitution Test 1: What Constitutes an “AI Payoff”?
- Definition A — Task-Level Cost Deflation & Quality-Adjusted Consumer Surplus (Microeconomic Definition):
- Operational Definition: Measurable reductions in unit labor time per bounded task (
coding,document summarization,customer support resolution,claims triage) or faster product iteration cycles. - Empirical Reality: Proven Positive (
+14%to+34%task speedups in controlled NBER studies such as Brynjolfsson, Li & Raymond 2023, NBER w31161).
- Operational Definition: Measurable reductions in unit labor time per bounded task (
- Definition B — Index-Wide Expansion in Real Revenue per Worker & GAAP Net Profit Margins (Sløk’s Macro Definition):
- Operational Definition: An upward inflection in inflation-adjusted aggregate top-line revenue divided by headcount (
R_real / L) and net income margin (NI / R) across all 493 non-tech companies in the S&P 500. - Why Substituting Definition B Creates a Macroeconomic Fallacy:
Suppose all major US retail banks (
JPMorgan,Bank of America,Wells Fargo,Citigroup) deploy AI to cut loan-underwriting document processing time by40%. Does that cause the aggregate inflation-adjusted revenue of the US banking sector to jump40%? No! Total loan demand is governed by macro GDP and interest rates, while competitive pressure forces banks to pass process savings to borrowers or use them to offset rising regulatory and funding costs. In competitive markets, universal adoption of a cost-saving technology creates consumer surplus and prevents margin erosion, rather than expanding industry-wide top-line revenue per employee!
- Operational Definition: An upward inflection in inflation-adjusted aggregate top-line revenue divided by headcount (
3.2 Substitution Test 2: “Calculation” vs. “Business Judgment”
In his third paragraph, Sløk writes: “AI may be a great calculator, but in business, intelligence is mostly judgment.” In the economics of artificial intelligence—formalized by Ajay Agrawal, Joshua Gans, and Avi Goldfarb in “Prediction, Judgment, and Complexity” (NBER w24235)—decision-making consists of two distinct mathematical operations:
- Prediction / Calculation (
P(s | x)): Estimating the conditional probability distribution of states of the worldsgiven high-dimensional input tokensx. Foundation models makeP(s | x)orders of magnitude cheaper. - Judgment (
u(a, s)under Fiduciary Liability): Assigning the payoff and loss matrixu(a, s)for taking actionawhen statesoccurs—including legal liability, regulatory compliance, customer trust, brand equity, and moral accountability when a rare tail states_tailmaterializes.
Because an LLM has zero legal personhood, zero balance sheet to absorb fines, and zero reputational skin in the game, it can calculate P(s | x) but cannot supply or bear the consequences of u(a, s).
flowchart TD
    subgraph SG1["1. The Mag 7 & VC Token Ouroboros (Where AI Revenue Shows Up Today)"]
        A["Hyperscaler CapEx & VC Funding<br/>(USD 300B+ Cloud CapEx + Venture Equity)"] --> B["Top 1% AI Token Spenders<br/>(Chart 5: 80.4% VC-Backed Startups)"]
        B --> C["Foundation Model APIs & Cloud Routers<br/>(OpenAI, Anthropic, AWS, Azure, GCP)"]
        C --> D["Mag 7 Revenue/Worker (+38.4% to USD 782k)<br/>& Mag 7 Net Margins (29.8%)"]
    end

    subgraph SG2["2. The S&P 493 Real Economy Bottleneck (Where AI Payoff Stalls)"]
        E["S&P 493 Enterprise AI Trials<br/>(USD 30/seat Copilots & Token Pilots)"] --> F{"Task Type:<br/>Calculation vs. Judgment?"}
        F -- "Bounded Calculation (Code, Triage, Search)" --> G["Micro Task Speedup (+14% to +34%)<br/>Absorbed into Competitive Pricing & Workloads"]
        F -- "High-Stakes Business Decision" --> H["Judgment, Trust & Fiduciary Liability Wall<br/>(Requires Human Verification & Intangible Redesign)"]
        G --> I["S&P 493 Aggregate Metrics:<br/>Revenue/Worker Flat (~USD 527k), Margin Flat (~10.2%)"]
        H --> I
    end

    E -. "IT Budget Transfer (Cost Center)" .-> C
Phase 4: Causal Disentanglement & The 4-Way Causal Audit
Why did Mag 7 revenue per worker (~USD 782k) and profit margins (~29.8%) surge between 2023 and 2026 while S&P 493 revenue per worker (~USD 527k) and profit margins (~10.2%) remained flat? We test Sløk’s single-cause interpretation against all four rival causal mechanisms:
| Causal Hypothesis | Mechanistic Pathway | Primary Empirical Evidence | Explanatory Weight |
|---|---|---|---|
1. Direct Causation (Sløk’s Thesis: X → Y) |
AI tools lack contextual business judgment and accountability, so S&P 493 token spending generates zero net revenue or margin improvement and acts purely as an IT cost center. | Substantial (~30%). Blanket rollouts of horizontal chatbots (USD 30/user/month) across non-technical S&P 493 staff often save 20 minutes of email drafting without reducing headcount or increasing unit sales, while complex workflows remain blocked by hallucination liability and data silos. |
High (30%) |
| 2. Value-Chain Rent Transfer (Shovel-Seller vs. Shovel-Buyer) | The Mag 7 (Nvidia, MSFT, GOOGL, AMZN) are the suppliers capturing monopoly rents on AI infrastructure, while the S&P 493 are the customers paying for that infrastructure out of SG&A/CapEx. |
Dominant (~35%). When an S&P 493 bank or pharmaceutical firm spends USD 200M on cloud GPUs and enterprise AI licenses, that USD 200M is recorded as revenue for the Mag 7 and operating expense / CapEx for the S&P 493! Furthermore, Mag 7 revenue/worker jumped from USD 565k (2023 Q1) to USD 782k (2026 Q3) because Nvidia’s revenue quadrupled on minimal headcount growth while Meta, Alphabet, Amazon, and Microsoft froze hiring after their 2020–2022 pandemic binge. |
Dominant (35%) |
3. Lurking Third Variable (Confounder Z) |
Post-2022 interest-rate normalization (SOFR > 4.5%), physical labor inflation, and S&P 493 sectoral composition (Walmart, Home Depot, HCA, UPS) mask operational gains. |
Moderate (~15%). The Mag 7 hold net cash balances that earned billions in interest income as rates rose in 2023–2026, whereas the S&P 493 carry net debt that faced higher refinancing costs. Moreover, S&P 493 headcount is dominated by frontline physical workers (retail clerks, nurses, truck drivers, factory technicians) whose output cannot be automated by text tokens. |
Moderate (15%) |
| 4. Dynamic Productivity J-Curve Lag (Brynjolfsson, Rock & Syverson 2021) | General Purpose Technologies (GPTs) require 5–8 years of uncapitalized intangible investment (workflow redesign, governance, data pipelines) that depresses measured TFP and corporate margins before the payoff phase begins. |
Significant (~20%). During the early 1990s PC/Internet buildout (1991–1995), S&P ex-tech margins and Fernald’s TFP showed zero acceleration until complementary ERP and supply-chain workflows matured in 1996–2004. |
Significant (20%) |
Phase 5: Quantitative & Statistical Integrity Audit (Deconstructing Charts 3, 4, and 5)
In Phase 5 (Chapter 10 of Browne & Keeley), we subject Apollo’s quantitative exhibits to the Blinding Test, Baseline Denominator Audit, and Formal Growth-Accounting Derivation.
5.1 Deconstructing Chart 4: The Zipf/Pareto Firm-Size Base-Rate Illusion
Look closely at Chart 4 (Oct24_Chart4.png), which Sløk titles “AI spending is extremely concentrated in a small number of firms” based on Ramp corporate spend data compiled by Ramp Chief Economist Ara Kharazian. Here is the exact data table from Chart 4:
| Spend Category (Apollo Chart 4 / Ramp Dataset) | Top 10% of Firms (% of Total Spend) |
Bottom 90% of Firms (% of Total Spend) |
Category Type & Baseline Comparison |
|---|---|---|---|
| Model Serving & Inference (e.g., Baseten, Together, Fireworks) | 99.5% |
0.5% |
Developer AI Infrastructure (Used by software builders, not end-user SMBs) |
| Neocloud (e.g., CoreWeave, Lambda, Crusoe) | 99.0% |
1.0% |
Bare-Metal GPU Clusters (Wholesale compute rented by frontier labs/tech) |
| Cloud computing (AWS, Azure, Google Cloud) | 95.7% |
4.3% |
Non-AI Baseline 1: Traditional Cloud Infrastructure (MORE concentrated than OpenAI + Anthropic!) |
| OpenAI + Anthropic (Direct API & Enterprise Chat/Claude) | 95.6% |
4.4% |
Core Enterprise AI Spend (Identical concentration to Traditional Cloud Computing!) |
| Paid Ads (Google, Meta, LinkedIn Ads) | 91.9% |
8.1% |
Non-AI Baseline 2: Digital Marketing Spend |
| SaaS excluding AI (General Enterprise Software) | 91.8% |
8.2% |
Non-AI Baseline 3: Traditional B2B Software Spend |
| CRM (Salesforce, HubSpot) | 84.2% |
15.8% |
Non-AI Baseline 4: Sales Seat Software |
xychart-beta
    title "Apollo Chart 4 Audit: Share of Spend by Top 10% of Firms (%)"
    x-axis ["Model Serving", "Neocloud", "Cloud (Non-AI)", "OpenAI+Anthropic", "Paid Ads (Non-AI)", "SaaS ex-AI", "CRM (Non-AI)"]
    y-axis "Top 10% Firm Share (%)" 0 --> 100
    bar [99.5, 99.0, 95.7, 95.6, 91.9, 91.8, 84.2]
[!WARNING] The Chapter 10 Blinding Test Verdict on Chart 4: If you cover up Sløk’s headline (“AI spending is extremely concentrated in a small number of firms”) and compare
OpenAI + Anthropic(95.6%Top-10% share) against the non-AI baselines in the very same table—Cloud computing(95.7%),Paid Ads(91.9%), andSaaS excluding AI(91.8%)—you discover that direct foundation-model spending is NO MORE concentrated among the Top 10% of firms than standard cloud computing (95.7%) or traditional non-AI SaaS (91.8%)!
Why do the Top 10% of firms account for 91.8% to 95.7% of every major B2B spending category (Cloud, OpenAI + Anthropic, Paid Ads, SaaS ex-AI)? Because firm size S (measured by employees or revenue) in the United States follows a Zipf / Pareto Power-Law Distribution with tail exponent ζ ≈ 1.05–1.15:
$$P(S > s) = \left( \frac{s_{\min}}{s} \right)^{\zeta} \implies \text{Share of Total Spend by Top } p \text{ Fraction of Firms } \approx p^{1 - \frac{1}{\zeta_{\text{eff}}}}$$
When 90% of corporate card customers are small 10-to-50-person businesses and the Top 10% include 5,000-to-50,000-person enterprises, the Top 10% naturally generate 90%–96% of total dollar volume across all enterprise software! Pointing to a 95.6% Top-10% share for OpenAI + Anthropic without noting that Cloud computing sits right next to it at 95.7% is a textbook Baseline Omission Fallacy. (And the 99.0%–99.5% concentration for Neocloud and Model Serving & Inference simply reflects that non-tech companies do not rent raw H100 clusters from CoreWeave—software vendors do.)
5.2 Deconstructing Chart 3: Why Fernald’s TFP Dips to 0% During a Capital Buildout (The Productivity J-Curve Math)
In Chart 3 (Oct24_Chart3.png), Sløk plots two series through 2026:
- BLS Nonfarm Business Labor Output per Hour (
OPHNFB, grey line): Growing at a solid+2.2% to +2.9% YoYin 2024–2026 (nearly double the1.2%average of the 2011–2018 expansion). - San Francisco Fed Utilization-Adjusted Total Factor Productivity (
TFP, Fernald 2014, green line): Dropping from+3.3% YoYin late 2023 down to~0.0% to -0.3% YoYin 2025–2026.
Why is Labor Productivity (Y/L) rising at ~2.5% YoY while Utilization-Adjusted TFP has fallen to ~0%? Look at the Solow-Fernald growth-accounting equation:
$$\Delta \ln(\text{TFP}_{\text{measured}}) = \Delta \ln Y - \alpha \cdot \Delta \ln K - (1 - \alpha) \cdot \Delta \ln(L \cdot Q_L) - \Delta \ln U$$
Where Δln Y is real output growth, Δln K is capital services growth (weighted by capital income share α ≈ 0.38), Δln(L · Q_L) is composition-adjusted labor hours, and Δln U is factor utilization.
- The Capital-Deepening Subtraction Effect (
-α Δln K): Between 2024 and 2026, US corporations deployed an unprecedentedUSD 250B–400B/yearinto AI data centers, GPUs, and power infrastructure. In national income accounting, those GPUs immediately enter the measured capital stockK, causingα · Δln Kto spike upward. Because those data centers take 12–36 months to energize and years for S&P 493 enterprises to integrate into revenue-generating products,α · Δln Kis subtracted fromΔln Ytoday, mechanically pushingΔln(TFP_measured)down toward zero! - The Brynjolfsson-Rock-Syverson “Productivity J-Curve” (
NBER w25892): As Erik Brynjolfsson, Daniel Rock, and Chad Syverson proved in “The Productivity J-Curve: How Intangibles Complement General Purpose Technologies”, when firms adopt a General Purpose Technology (GPT), they divert existing labor and resources into building unmeasured intangible organizational capitalI(cleaning legacy databases, rewriting compliance workflows, training staff) that is expensed rather than counted in measured GDPY. Consequently, measuredTFPsystematically understates true productivity growth during the investment phase before overshooting later:
$$\Delta \ln(\text{TFP}{\text{measured}}, t) = \Delta \ln(\text{TFP}{\text{true}}, t) - \phi_I \cdot \left( \Delta \ln I_t - \Delta \ln Y_t \right)$$
During the initial buildout when intangible organizational investment grows faster than output (Δln I_t > Δln Y_t), measured TFP drops into the trough of the J-Curve—exactly as seen on Sløk’s own Chart 3 between 1992 and 1995 (TFP fell to -3% to 0%) right before the 1996–2004 Internet/ERP productivity boom!
5.3 Where Sløk Is Mathematically Right: Chart 5 (80.4% VC Circularity) & The Judgment Liability Inequality
While Chart 4 suffers from a base-rate illusion and Chart 3 reflects the early J-Curve trough, Chart 5 (Oct24_Chart5.png) and Sløk’s Judgment Thesis expose genuine structural vulnerabilities in the 2026 AI economy:
- Chart 5 — The
80.4%VC Token Ouroboros: Among the Top 1% of AI spenders on Ramp,80.4%are VC-backed companies (and only19.6%are Non-VC companies), whereas for the Median spender,86.9%are Non-VC companies and only13.1%are VC-backed. This proves that the hyper-intensive tail of token consumption today is heavily subsidized by venture capital recycling money back to foundation model labs and cloud hyperscalers. - The Mathematical Boundary Between Calculation and Judgment: Why are the
86.9%Non-VC mainstream companies reluctant to scale autonomous agentic token spend? We can formalize Sløk’s insight (“AI may be a great calculator, but in business, intelligence is mostly judgment… accountability, trust, culture, unwritten rules, ethical trade-offs”) alongside MIT economist Daron Acemoglu’s (2024, The Simple Macroeconomics of AI, NBER w32487) task-based model.
For an S&P 493 enterprise considering replacing or augmenting a human professional in workflow task τ, the net profit impact Δπ(τ) per decision is:
$$\Delta \pi(\tau) = \underbrace{w_{\text{human}} \cdot \Delta t_{\text{calc}}(\tau)}{\text{Gross Calculation Savings}} - \underbrace{c{\text{tokens}}(\tau)}{\text{Token Cost}} - \underbrace{w{\text{human}} \cdot t_{\text{verify}}(\tau)}{\text{Human Judgment & Audit Cost}} - \underbrace{p{\text{err}}(\tau) \cdot L_{\text{fiduciary}}(\tau)}_{\text{Expected Liability & Reputational Loss}}$$
Look at the four terms in this inequality across two different task regimes:
- Regime 1 — Low-Liability, Verifiable Calculation Tasks (
Code autocomplete,Internal search,Tier-1 FAQ routing): Here, fiduciary lossL_fiduciary ≈ 0and verification timet_verify << Δt_calc. ThusΔπ(τ) > 0. However, as Acemoglu (2024) demonstrated using US occupational task data, purely bounded, easily verifiable calculation tasks account for only~4.6%of total US wage-bill tasks over a 10-year horizon (yielding a modest macroTFPboost of~0.53%–0.66%total over 10 years, or~0.05%–0.07% per year). - Regime 2 — High-Context, High-Liability S&P 493 Decisions (
Medical diagnosis,Credit underwriting,Supply-chain contract renegotiation,M&A pricing,HR termination): In these core S&P 493 tasks, the downstream fiduciary, regulatory, or reputational lossL_fiduciary(τ)from a single context-blind hallucination or fairness violation is enormous (USD 100k to USD 100M+). Because an LLM cannot be held legally or culturally accountable, a senior human must still audit the context and sign off (t_verify(τ) ≈ Δt_calc(τ)). Whent_verify ≈ Δt_calc, the gross calculation savings cancel out, leavingΔπ(τ) ≈ -c_tokens(τ) < 0—turning token spend into a pure margin-diluting cost center, exactly as Sløk observes!
Phase 6: The “Negative View” & Omission Interrogation
To complete the forensic audit, we examine both the hidden casualties of Sløk’s diagnosis and the critical counter-trends that Sløk’s aggregate charts omit.
6.1 Who Loses Because Sløk’s Cost-Center & Circularity Diagnosis Is Right?
- Horizontal Seat-Licensed Enterprise AI (“The USD 30/User/Month Copilot Tax”):
S&P 493 CFOs audited their 2024–2026 enterprise software renewals and discovered that buying blanket
USD 30/monthAI seats for 50,000 employees (USD 18M/year) without workflow re-engineering merely subsidized faster internal slide decks while reducing net margins. Procurement is rapidly shifting from blanket seat licenses to outcome-based or narrow vertical deployments. - VC-Backed “Wrapper” Startups Dependent on Chart 5 Circularity:
Startups whose revenue comes from selling AI tools to other VC-backed startups (the
80.4%cohort in Chart 5) face an existential wall when venture funding tightens and S&P 493 procurement demands hard P&L accountability. - Frontier Model Premium Pricing for Routine Enterprise Tasks:
As Sløk notes, “mainstream corporate America does not need the latest model and is unwilling to pay for it.” For bounded enterprise tasks (classification, extraction, routing), S&P 493 IT departments are migrating away from expensive frontier reasoning tokens toward fine-tuned small language models (
SLMs), open-weight models, and cached distilled routers that cost10x–30xless per token.
6.2 What Sløk’s Aggregate S&P 493 Charts Omit (The Hidden Micro Payoffs)
While Sløk is right at the index aggregate level today, his conclusion that AI has delivered “zero financial payoff to corporate America outside of tech” omits three structural realities:
- Simpson’s Paradox & Headcount-Weighted Index Distortion:
In the S&P 493, total employment is heavily skewed toward physical-labor giants (
Walmartalone employs2.1 millionpeople; addHome Depot,Target,Kroger,UPS,FedEx,HCA Healthcare, andMarriott). Because LLMs do not stock grocery shelves or drive delivery vans, aggregate S&P 493Revenue / Employeeis mathematically anchored by physical service labor, masking15%–25%software-engineering and claims-processing productivity gains inside S&P 493 financial, insurance, and pharmaceutical leaders (JPMorgan Chase,Progressive,Eli Lilly,John Deere). - Census Bureau BTOS Firm-Level Adoption Trajectory:
According to the U.S. Census Bureau’s Business Trends and Outlook Survey (
BTOS), the share of US firms actively using AI to produce goods and services rose from~3.7%in late 2023 to~6%–10%+across non-tech sectors by 2025–2026—still early on the S-curve (<15%diffusion), which explains why macroTFPhas not yet inflected even if early adopters are capturing task-level savings. - Defensive Counterfactuals (Avoiding Hiring vs. Firing):
In 2024–2026, S&P 493 companies used AI primarily for hiring avoidance in customer support, legal review, and internal IT maintenance—keeping headcount flat while absorbing real output growth (
+2.3%–2.9% YoYlabor output per hour on Chart 3!).
Phase 7: Grey Thinking (“If-Clauses”) & The Forensic Verdict
We synthesize our investigation into conditional If-Clauses and an explicit probability-weighted forecast for how the S&P 493 AI story will resolve between 2026 and 2030.
7.1 Conditional Strategic Synthesis (“If-Clauses”)
- If you are an S&P 493 CEO or CFO allocating 2027 IT budgets:
- If your AI spend consists of horizontal chat seats and un-routed frontier token consumption layered on top of unchanged human sign-off workflows (
t_verify ≈ Δt_calc), then Sløk is 100% right: your AI spend is a pure margin-diluting cost center (Δπ < 0) and should be cut or migrated to low-cost distilled models. - If you deploy AI inside bounded, verifiable workflows where schema validation, deterministic guardrails, and ERP integration allow genuine process restructuring (
t_verify << Δt_calc), then you will capture15%–30%unit-cost deflation even while your industry’s aggregate revenue per employee looks flat on a Bloomberg chart.
- If your AI spend consists of horizontal chat seats and un-routed frontier token consumption layered on top of unchanged human sign-off workflows (
- If you are an Enterprise AI Vendor or VC Investor:
- If your revenue growth relies on the
80.4%VC-backed cohort in Chart 5 or assumes S&P 493 buyers will pay frontier token prices for generic calculation, then your business model faces severe multiple compression in 2027. - If your product solves the Judgment & Accountability Bottleneck—providing auditable provenance, deterministic compliance bounds, and contractual error-liability indemnification for S&P 493 workflows—then you unlock the
86.9%Non-VC mainstream market.
- If your revenue growth relies on the
7.2 The Forensic Verdict: What We Actually Think
| 2026–2030 S&P 493 AI Payoff Scenario | Epistemic Probability | Mechanistic Drivers & Macro Outcome | Market & Sector Impact |
|---|---|---|---|
| Scenario A: The Acemoglu / J-Curve Gradual Diffusion (Base Case) | ~55% | S&P 493 firms prune wasteful horizontal token/seat spend in 2027 and spend 3–5 years re-engineering vertical back-office workflows (insurance, banking, pharma, logistics). Macro TFP rises modestly (+0.07% to +0.25%/yr per Acemoglu 2024), while most efficiency gains pass through to consumers or offset demographic labor shrinkage rather than exploding S&P 493 margins to Mag 7 levels. |
Winners: S&P 493 Vertical Workflow Integrators, Distilled/Small-Model Infrastructure, Data-Rich Incumbents. Losers: Horizontal AI Wrapper Startups, Over-priced Seat-License SaaS. |
| Scenario B: The Sløk Cost-Center Stagnation & CapEx Digest (Bear Case) | ~30% | Fiduciary liability, regulatory friction, and organizational inertia permanently cap autonomous AI deployment outside coding and customer service. S&P 493 enterprises slash AI software budgets in 2027–2028, bursting the Chart 5 VC token loop (80.4% VC spenders) and forcing a sharp downward reset in Mag 7 cloud/GPU CapEx multiples. |
Winners: Old-Economy Value Equities (S&P 493 defensive cash flow), Short-duration Credit.Losers: Mag 7 Valuation Multiples, Unprofitable AI SaaS, Speculative Data Center Lenders. |
| Scenario C: Fast Agentic Breakout Across S&P 493 (Bull Case) | ~15% | Verifiable neuro-symbolic and tool-using agent architectures solve the auditability bottleneck by 2028, enabling end-to-end automation of complex supply-chain, legal, and clinical workflows and driving a 1996-style TFP surge (+1.5%+/yr) and +200 bps S&P 493 margin expansion. |
Winners: Frontier Model Labs, Hyperscaler Model Routers, Early-Adopting S&P 493 Operators. Losers: Slow-moving S&P 493 laggards, Legacy BPO Outsourcing firms. |
Bottom-Line Verdict: Torsten Sløk’s October 24, 2026 Daily Spark is right for the wrong reasons on Charts 1, 3, and 4, and dead-on bullseye on Charts 2, 5, and the Judgment Problem.
- Where to push back on Sløk: Do not be fooled by Chart 4’s claim that a
95.6%Top-10% firm share ofOpenAI + Anthropicspend proves abnormal concentration—traditionalCloud computingsits at95.7%andSaaS excluding AIat91.8%in the exact same table because corporate firm size obeys Zipf’s law. Likewise, do not expect S&P 493 inflation-adjusted revenue per worker (Chart 1) or early-buildoutTFP(Chart 3) to mirror the Mag 7 shovel-sellers during the heavy CapEx phase of the Productivity J-Curve. - Where to agree strongly with Sløk: Chart 2 and Chart 5 deliver an undeniable wake-up call. With
80.4%of the Top 1% of token spenders backed by venture capital and S&P 493 profit margins stuck at~10.2%, the AI boom through 2026 has operated primarily as a wealth transfer from S&P 493 IT budgets and VC balance sheets into Mag 7 profit margins (~29.8%). Until AI systems cross the chasm from cheap statistical calculation to auditable, liability-backed institutional judgment, the S&P 493 will increasingly treat generic token spending as an overhead cost to be minimized rather than a growth engine to be chased at any price.
Primary Sources & Verification References
- Apollo Global Management — Dr. Torsten Sløk (
Oct 24, 2026): “No Signs of AI Payoff Outside the Tech Sector”, The Daily Spark — Apollo Official Publication- Primary Chart Artifacts: Chart 1: Revenue per Worker (
Oct24_Chart1.png) | Chart 2: Profit Margins (Oct24_Chart2.png) | Chart 3: TFP vs. Labor Output per Hour (Oct24_Chart3.png) | Chart 4: Spend Concentration by Top 10% of Firms (Oct24_Chart4.png) | Chart 5: VC vs. Non-VC AI Spend Intensity (Oct24_Chart5.png)
- Primary Chart Artifacts: Chart 1: Revenue per Worker (
- Federal Reserve Bank of San Francisco (
FRBSF— John Fernald): Total Factor Productivity (TFP) — Utilization-Adjusted Quarterly Series — FRBSF Official Data Portal - Federal Reserve Bank of St. Louis (
FRED) & U.S. Bureau of Labor Statistics (BLS): Nonfarm Business Sector: Labor Productivity (Output per Hour) for All Workers (OPHNFB) — FRED SeriesOPHNFB - U.S. Census Bureau: Business Trends and Outlook Survey (
BTOS) — Artificial Intelligence Supplement — U.S. Census BTOS Portal - Brynjolfsson E, Rock D, Syverson C (
2021): “The Productivity J-Curve: How Intangibles Complement General Purpose Technologies”, American Economic Journal: Macroeconomics 13(1):333–372 — NBER Working Paperw25892| NBER Working Paperw24001(AI and the Modern Productivity Paradox) - Acemoglu D (
2024): “The Simple Macroeconomics of AI”, Economic Policy / MIT — NBER Working Paperw32487 - Agrawal A, Gans JS, Goldfarb A (
2018): “Prediction, Judgment, and Complexity: A Theory of Decision Making and Artificial Intelligence” — NBER Working Paperw24235 - Brynjolfsson E, Li D, Raymond LR (
2023/2025): “Generative AI at Work”, Quarterly Journal of Economics — NBER Working Paperw31161| arXiv Preprint (2304.06435)